Open-data research
India District Growth Atlas
An explorer and visual studies of India's built environment, population, and economic activity.
Built space and economic output
Building volume per person and nominal GSDP per person. Each dot is a state or union territory.
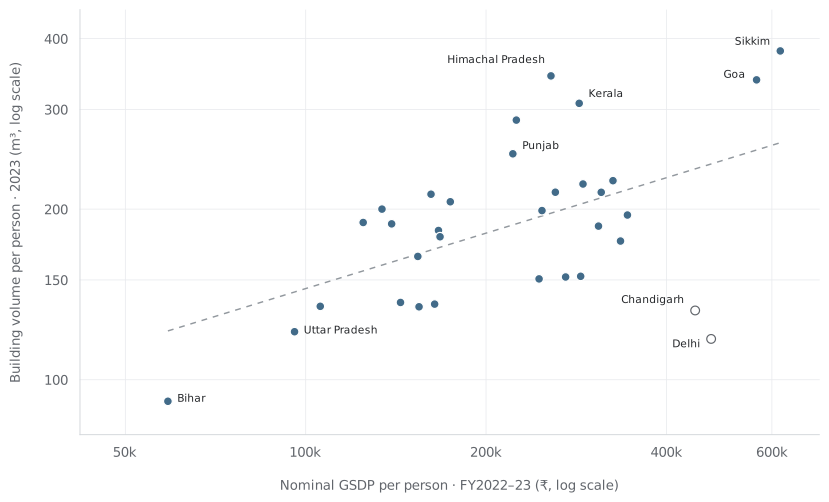
The relationship strengthens when Delhi and Chandigarh are removed. Both measures share a population denominator; this is a descriptive comparison.
The district view
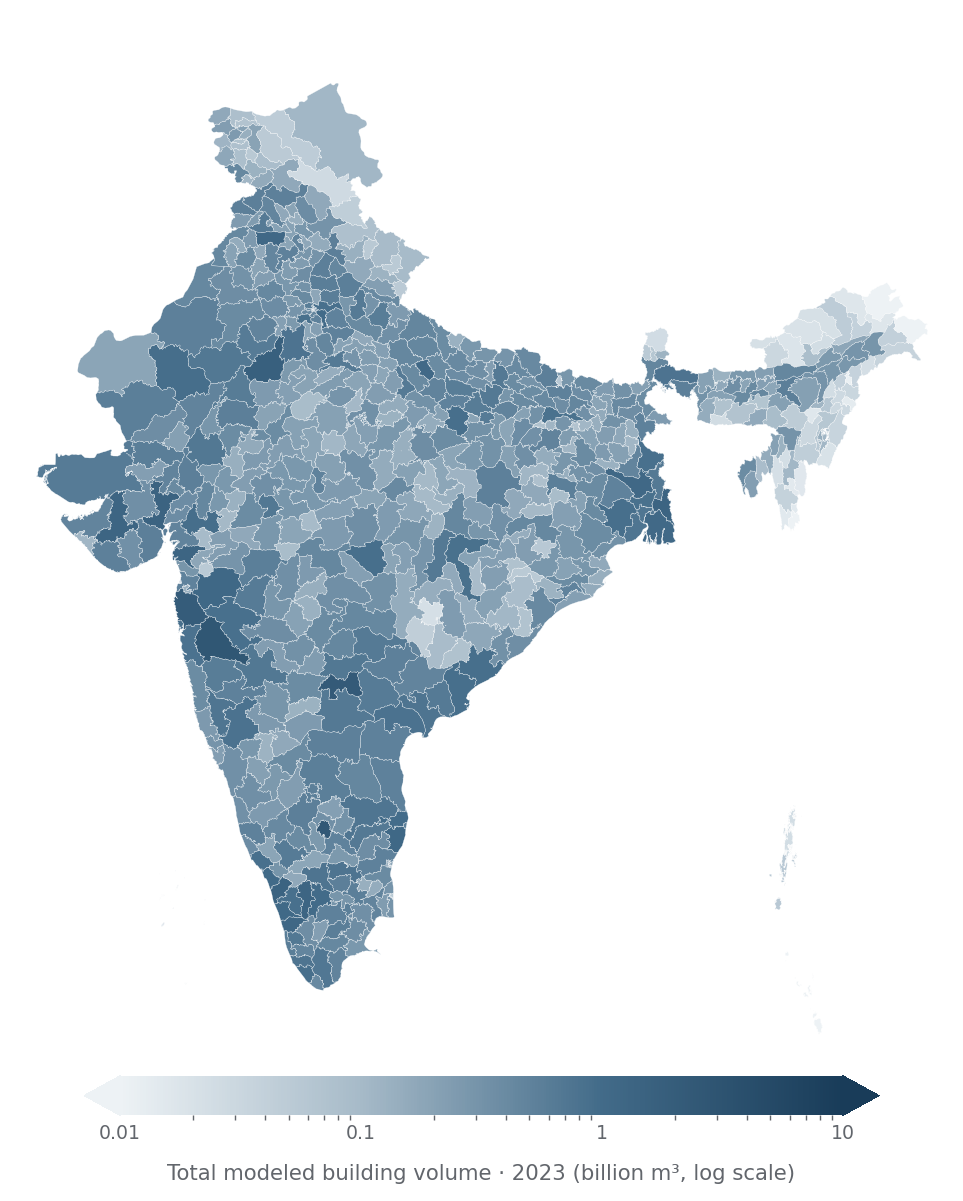
Modeled building volume across 640 districts, using the source’s 2011 district geography.
Growth tells a different story
Nominal GSDP growth compared with nighttime-light growth across the same 33 states and union territories.
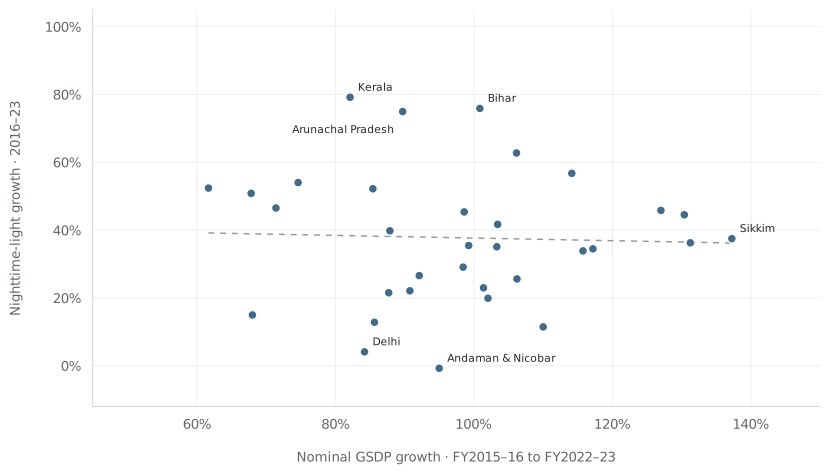
In this sample, growth in lights is a poor stand-in for growth in nominal economic output.
Data and method
I built the explorer, aggregated district data to states and union territories, and compared levels and growth. The figures here replot the original analysis inputs.
Satellite data: XKDR Forum, using Google Open Buildings and VIIRS. Geometry and measures are joined by district ID. Andhra Pradesh / Telangana and Jammu & Kashmir / Ladakh follow the harmonization in the original scripts.
GSDP and population estimates are the values recorded in that analysis, rather than newly verified official estimates. GSDP is nominal; volume is modeled. The population-adjusted partial correlation of log total volume and log total GSDP is +0.40 for all 33 states / UTs, and +0.66 after excluding Delhi and Chandigarh. That adjustment does not establish causation.